|
Mulan :: MUltiple sequence Local AligNment and conservation visualization tool INSTRUCTIONS |
|
TABLE OF CONTENTS Introduction. Alignment of "draft"-quality sequences. Alignment of "finished"-quality sequences. Results: Dynamic conservation profiles. Detection of transcription factor binding sites shared among multiple species. Multiple sequence textual alignments. Dynamic extraction of ECRs. Other features. Citing Mulan. Introduction Mulan performs multiple (2 or more) sequence alignments with an efficient and rapid "full local" alignment strategy that ensures a recapitulation of evolutionary sequence rearrangements (such as inversions and reshuffling) in any of the species. It combines refine and tba tools to align either "draft" or "finished" quality sequences. Mulan provides a dynamic graphical interface to align and visualize conservation profiles for evolutionarily distant and closely related species. Input formats, automated data upload from the UCSC Genome Browser, gene annotation, annotation of repetitive elements, and progress report were previously described in the zPicture instructions and we refer the users to these materials for more details. This introduction is mainly focused on some novel features unique to the Mulan. Also, for greater details, the main features of the Mulan tool have been described in I. Ovcharenko et al, Mulan: Multiple-Sequence Local Alignment and Visualization for Studying Function and Evolution, Genome Research, 15, 184-194, (2005). Alignment of "draft"-quality sequences. It is possible to align several sequences represented as multiple contigs (an example: multiple-contigs FASTA file) to a single contig reference sequence using the Mulan tool. In order to do so, the user needs to select the number of species (including the reference sequence) and to click on the right "Select" button on the main Mulan web page at https://mulan.dcode.org. This option provides an easy access for an efficient order-and-orientation (O&O) of secondary sequences based on the homology guided by the reference sequence. Two visualization options are implemented to assist users with the O&O . contigs positional annotation on the conservation profiles and a color-coding of the homology dot-plots.  Figure 1. A "draft"-quality secondary chicken sequence consisting of three scaffolds (Contig2, Contig3, and Contig4) was aligned on top of a homologous segment from the chicken genome. Top layer indicates the order and location of the contigs imposed by the reference sequence. Purple color corresponds to reverse strand alignments, red color . to forward strand alignments.  Figure 2. A dot-plot of three-contigs chicken sequence aligned to the homologous contiguous sequence. Different colors correspond to different contigs as labeled on the vertical axis. Alignment of "finished" quality sequences.  The majority of the Mulan sequence analysis options correspond to the alignments of "finished"-quality sequences (sequences that are represented by a single contig). As schematically visualized on this diagram, multiple sequences will be automatically separated into blocks of homology and each of these blocks will be represented as a multiple sequence alignment independently of the order or orientation of the block-constructing subsequence from a particular species. Briefly, the local alignment nature of the Mulan ensures a recapitulation of the evolutionarily sequence rearrangements in all the species.
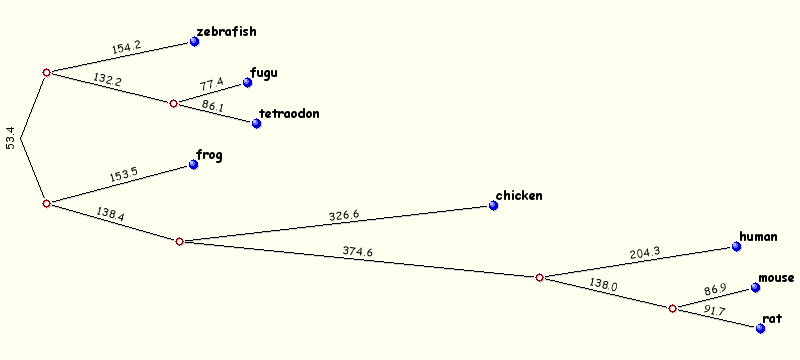
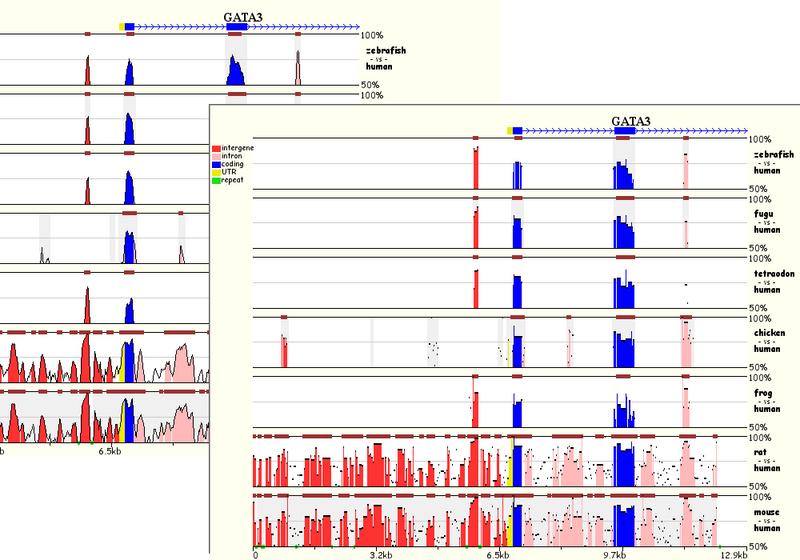
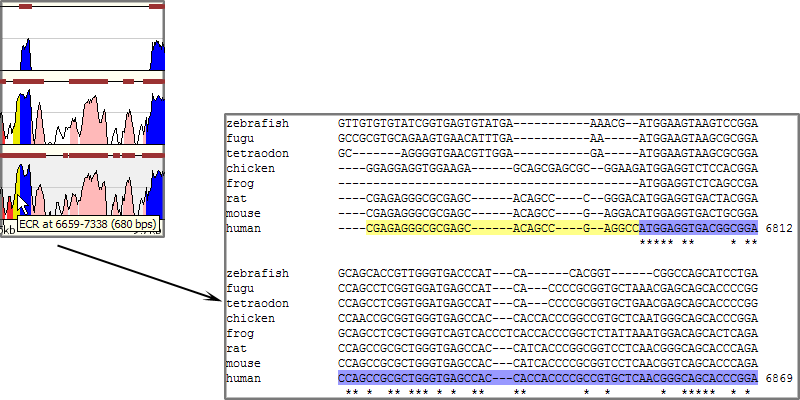
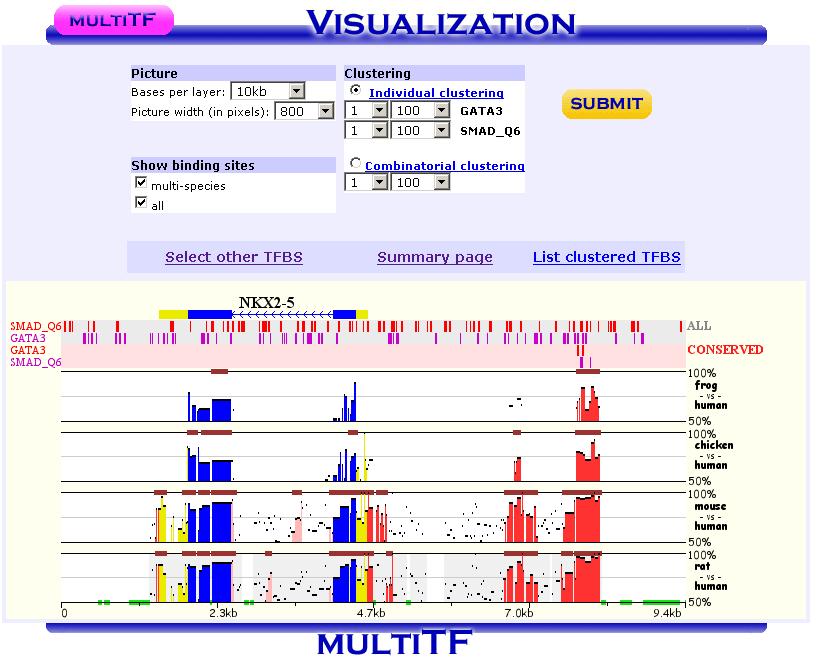
Correct specification of phylogenetic relationships among the input sequences represents an important guidance data for the tba alignments utilized by the Mulan tool. Mulan does not requires the users to manually specify the phylogenetic relationships, but instead it predicts them at the first step of the alignment process, displays as a phylogenetic tree (Figure 3) and asks for a confirmation from the user. At this intermediate stage users can modify the automated predictions of the phylogenetic relationships among the input sequences to refine the evolutionary linkages between the species.  Figure 3. Phylogenetic tree automatically created by the Mulan to describe evolutionarily relationships between the human, rodents, chicken, frog, and fish sequences of the GATA3 locus. Every tree branch estimates a number of substitutions per 1kb of sequence. RESULTS. Dynamic conservation profiles. Mulan displays multiple sequence alignments as compact graphical conservation profiles as either smooth-graphs (with a sliding window counting the number of mismatches per each 100bps region) or pip-plots (that display location and percent identity of ungapped alignment blocks) - Figure 4.  Figure 4. Smooth- and pip- conservation profiles of the GATA3 locus in human, rodents, chicken, frog, and fish genomes as generated by Mulan. Mulan conservation profiles can be dynamically replotted based on the selection of data display parameters as selected by the user using the top bar at the conservation profile display page (Figure 5). Among the other parameters, the user can specify arbitrary parameters for the detection of ECRs, select one out of four possible graphical visualization options (including phylogenetic shadowing analysis of closely related sequences), and to dynamically select the reference organism.  Figure 5. Parameters selection toolbar encompassing graphical conservation profiles. ECRs are displayed as dark red blocks on top of each species conservation layer and they are hot linked to the underlying alignments. By clicking on an ECR, the user is automatically redirected to the web page that provides with the corresponding multiple sequence alignment. Different functional features are color-coded in the alignment for an easy visual separation of them from each other.  Figure 6. Dynamic mouse click on an ECR displays a color-coded alignment underlying that ECR. Coding exons are in blue, UTRs in yellow. Detection of transcription factor binding sites shared among multiple species. Mulan is dynamically interconnected with the multiTF utility (https://multitf.dcode.org) that identifies transcription factor binding sites (TFBS) that are shared among all the input species involved into the alignment (Figure 7). All the input sequences undertake an independent search for TFBS using Transfac Professions positional weight matrixes (PWMs). MultiTF scans through each of the predictions searching for a counterpart being present in other organisms that has to be interconnected with a corresponding TFBS in the reference sequence through a full match in the alignment. Identified TFBS are displayed in the format similar to the visualization scheme of the rVista 2.0 tool (https://rvista.dcode.org) that overlays them with the conservation profile. The user has the option to modify several parameters of the plot or to rerun the search with different similarity thresholds. Also, multiTF reports TFBS positions in all the sequences involved into the alignments allowing for an investigation of TFBS that are species-specific.  Figure 7. MulitTF annotation of TFBS in the NKX2.5 locus. Smad (red) and Gata3 (purple) transcription factors are annotated as tickmarks above the conservation plots. 5 Gata3 and 3 Smad sites are highly conserved and map to an experimentally defined enhancer element. Multiple sequence textual alignments Multiple sequence local alignments generated by Mulan using the tba alignment program can be represented as a sum of small blocks of contiguous alignments with each of them including a subset of input species. For example, a piece of sequence that is specific only to fish will be aligned within the sequences encompassing exclusively the fish lineages, while the rodents-specific elements will be backed up by alignment blocks consisting of rodent sequences only. Order or orientation of the sequences constructing a particular block does not matter, while the complete alignment is done in a matter that maximizes the total score through all the possible alignment blocks. This "local" nature of the Mulan multiple sequence alignments does not allow a generation of a uniform ClustalW-like alignment file. Instead, the user can either download original tba alignments in the FASTA-like "maf" format or to obtain projections of the full multiple sequence alignment to one of the species sequences as a reference sequence. The selection of the reference sequence is dynamic allowing the study of alignment projections to any of the input species.  Figure 8. Selection of a reference sequence for the generation of a Mulan textual alignment. Dynamic extraction of ECRs. Every pairwise alignment involving a reference sequence can be investigated for the presence of ECRs. Subsequently a printout of positions of the ECRs is being generated listing also their length and percent identity. The user can dynamically change the thresholds for the ECR detection specifying the minimal length and minimal percent identity. For example, "ultraconserved" elements in human-mouse alignments can be easily extracted using this feature and 200bps, 100% identity thresholds. Other features. There are several other feature available from the Mulan results web page. Those include pairwise conservation profiles, pairwise dot-plots, dynamic update of the sequence titles, update of gene annotations, tba, refine, blast and blastz alignments, and an access to all the input and intermediate data files. Citing Mulan. Mulan was developed by Ivan Ovcharenko in collaboration with Gabriela G. Loots, Lisa Stubbs, Belinda M. Giardine, Minmei Hou, Jian Ma, Ross C. Hardison, and Webb Miller. If you find this tool useful in your research please cite it as (I. Ovcharenko, G.G. Loots, B.M. Giardine, M. Hou, J. Ma, R.C. Hardison, L. Stubbs, and W. Miller, Mulan: Multiple-sequence local alignment and visualization for studying function and evolution, Genome Research, 15, 184-194 (2005) [PDF]). |